2/26/2017

The Results Section

This week is dedicated to composing a results section that conveys, ultimately, the end goal of our year-long research project. Last week, I was able to finish the bulk of my data analysis. I spent this past week finding other trends within my data that could bolster my main conclusion or provide insight that is missing or lacking in this sphere of research. I found that on average, females improved more than males, teenagers improved more than young children, but younger adults improved more than older adults. Now, I am trying to outline a way to present these results to not overwhelm the readers, but rather keep them interested and informed.

I reviewed three studies that were about ADHD, two about neurofeedback therapy, that employed the same method of the t-test as mine. While I did a one-tailed, paired t-test, these studies used a one-tailed t-test, but the results are comparable to my study.

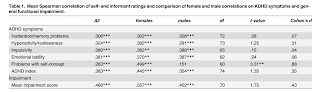
The first study, "Attention-Deficit/Hyperactivity Disorder (ADHD) in Adulthood: Concordance and Differences between Self- and Informant Perspectives on Symptoms and Functional Impairment" by Morstedt, Corbisiero, Bitto, and Stieglitz, investigated the differences in diagnostic measures to detect ADHD. The study presented the results in a table comparing the female and male correlations on ADHD symptoms. The t-value, degrees of freedom, and the p-value were recorded. Underneath, the results were not only summarized but explained in relation to each other. For example, it was identified under the table that males were more likely to rate the hyperactivity/restlessness symptom higher than females and other trends that can be siphoned from the raw data in the table. The t-values are described in comparison with each other, rather than stated independently with no context. I can use this when I convey my results, providing further explanation under a raw table. It is vital to have the t-values there, but, without an explanation, the significance would be lost on the readers. This study also broke down the results into different categories (first explaining the internal consistency measures, then the r-value, then the t-value). My research also has several parts that can be separated in a similar fashion (determining normal distribution, average score decrease, t-scores, and other trends).

The second study, "Efficacy of Neurofeedback treatment in ADHD: The effects on Inattention, Impulsivity, and Hyperactivity: A meta-analysis" by Arns, Ridder, Strehl, Breteler, and Coenen, aimed to find the effect of neurofeedback therapy on treating ADHD in comparison to stimulant medication. Something I could replicate in my own research is the way that this study presents the general results/main conclusion first, and then goes into results of the subcategories and other data found. Like my study, they noted the number of sessions, neurofeedback therapy site on brain, age of the participant, and what brain waves frequencies were targeted. After a table of this information, the results were depicted in paragraph style above a graph describing the results. I can similarly start with my greater conclusion about the comparison of reduction of ADHD scores between children and adults and reflect the results through a graph. Then I could go into the smaller conclusions or calculations (the specific scored categories that make up the ADHD scores and the other trends). I need to be able to tie the smaller conclusions back to the adult/child group comparison at the end.


The third study, "The Effect of Neurofeedback Therapy on Reducing Symptoms Associated with Attention Deficit Hyperactivity Disorder: A Case Series Study" by Deilami, Jahandidedh, et al., aimed to measure the effect of 30 sessions of neurofeedback therapy on children 5-12 years old. Using graphs to depict the calculations with standard deviation and means of the results, the study went from the general conclusion to calculations and explanation. The results section of this paper was relatively short, describing the main conclusion with the dependent t-test in two quick paragraphs. I think a major problem with my results outline right now, as Mrs. Haag noted, is I have a lot of raw data and not enough consolidation of the information and connection back to the hypothesis and purpose of the paper. Using this study as reference, I can aim to make sure my results are not lost in calculations and are presented in a way that shows how they were found but also what they mean in easily understood terms.

All these studies had in common the presenting of the raw data in a table, a table for calculations, and then a simpler, short explanation for the general conclusions. The studies started with a general conclusion, went into specifics of its discovery, and then tied it back to the general purpose. Graphs and tables were primarily used to show the relationships between the average differences and the t values. These are all elements I can incorporate into my results section to hopefully reflect the significance of my work in a clear way.

(810)

2/19/2017

Data Analysis

This week marked the second and final week of data collection for my research. I was able to procure the necessary patient consent and analyze all 24 results like I intended to. Overall, I was able to get 12 adults and 12 children. As I stated last week, I was only able to get 10 males and 14 females, but from going through some previous sources and my literature review, I have found evidence that shows that the severity or type of ADHD does not differ depending on gender. Females and males alike are affected by ADHD the same way, so having a disproportionate number of each did not affect my results (or should not). After gathering all the data I needed, I met with Mrs. Haag and was able to work out a plan for data analysis. The majority of my analysis was conducted over this weekend and I was able to answer my question and find the greater conclusion of the study. So the rest of the week will be dedicated to finding some other key trends and outlining my results section. I also need to definitely present my conclusion in a cleaner way than I have it in my spreadsheet like through some tables and graphs to show the distribution of scores.

From conducting the paired t-test on the adults and children group (both by hand and by graphing calculator), I found the t-score for the children's group to be 4.95 and the t-score for the adults to be 5.53. I did this by taking into account the difference between the final and initial ADHD scores (from the ADHD diagnostic tests) for all the patients in each group. This was the procedure of how I did it:

1. Add up each category for first child patient to find initial ADHD score and final ADHD score.
    1. Highest possible score: 300
    2. Lowest possible score: 50
2. Determine if the results are a normal distribution for the children group, meaning when ADHD scores are plotted on an x,y graph (one for initial and one for final scores), there are less results in the extremes and more results for the moderate scores, forming an approximate bell curve.
2. Determine it is a normal distribution.
3. Calculate the difference by subtracting final score from initial score.
4. Take the absolute value of this difference.
5. Repeat for every child patient.
6. Add up all these difference values.
7. Square each difference value for every patient.
8. Add up all the squared difference values.
9. Find t-score using this equation:
For which, ΣD is the sum of the differences between final and initial scores.
ΣD2 is the sum of the squared differences
(ΣD)2 is the sum of the differences squared.
N is the number of samples
A t-score is the ratio between the difference between the initial and final score for each child and the difference within the total children data set. A larger t-value means the scores are more different, meaning a higher trend of improvement.
11. Find the degrees of freedom by subtracting 1 from total children sample size (12).
12. Then find the p-value in the standardize t-table with 11 degrees of freedom.
a.  The null hypothesis is established as follows: the distribution of results has a mean equal to 0.  
b.  The p-value will determine whether the results are due to chance or due to neurofeedback therapy sessions.
c.  The t-score will have a designated p-value that will show what is the probability that the results are due to random chance. The lower the p-value, the more likely the results are due to neurofeedback therapy sessions rather than chance, thus rejecting the null hypothesis.
12. Repeat steps 1-12 for adult group. 
13. After p-value for children group and adult group are checked to see if the difference is significant, then compare the t-scores.
14. Find the percent difference between adult and child value to see if significant difference.
a.    T-scores represent trend of improvement. The larger the t-score the larger the trend of improvement.
b.    Compare adult and child t-score to see which improved more.
c.     Take into account which has a lower p-value to see which value can be attributed less to chance and more to neurofeedback therapy sessions.
15. Conclude which group, if any, has a significantly higher trend of improvement. 
a.              Adult group t-score- child group t-score/adult group t-score
b.              According to standardized rules of statistics, if this number is higher than 5%, then percent difference is significant.
I used the t-scores to represent the trend of improvement of each group. The children's group p-value was 0.000218, meaning that, because it is less than 0.05, that the results are significant and not due to chance but rather that the neurofeedback therapy sessions did make an impact on reducing the ADHD scores. Similarly, for the adult group the p-value was 0.000089, which is less than 0.05, so the results are significant and not due to chance. On average, adult ADHD scores reduced by 75.6 and child ADHD scores reduced by 59.5. These results confirmed previous studies conclusions that neurofeedback therapy sessions do make a difference in treating ADHD patients.

To find which group improved significantly more than the other group, I calculated the percent difference. I found the adult's group to improve more than the children's group by 10.5% (more than 5%, so a significant difference). So, overall adults improved more than children by a significant percentage. This disproved my hypothesis. Using evidence from previous two studies conducted on neurofeedback therapy, I had predicted that neurofeedback would be more influential in treating inattention, a primarily childhood-associated symptom, than hyperactivity, an adult ADHD symptom, so this would mean children would improve more than adults. I was surprised by the actual results. This conclusion that adults improve more seems to counter the theory of neuroplasticity that brains can change throughout life, forming new connections between neurons and rewiring and reconfiguring existing connections based on experiences and learning. Children have been most evidenced to have increased neuroplasticity, as brains that are younger are still in the growth stage and have not undergone the "synaptic pruning" maturation stage, which is the altering of the brain structure and the reduction of connections that happens as we develop and age. Adults improving more than children, however, may not be due to children's lack of neuroplasticity, but might be due to the fact that it is hard to get children to sit down and concentrate. It takes more persuasion than it does for adults, who are motivated and realize that they have to consciously work every day for the sessions they pay for to pay off. This conclusion was really interesting and has brought forth more possibilities in other facets of neuroscience. I would like to include these additional ties in my conclusion as possible explanations of the outcome, but then I might have to rework/add it to my literature review.

So, now that I have the main conclusion I can start to look at other trends within the data. I would like to conduct additional statistical analyses to see whether there is a higher trend of improvement for younger ages of the children group more than the older ages (teenagers). I would also like to see if increased neurofeedback therapy sessions result in a greater reduction of symptoms, and thus a lower ADHD score, indicating more improvement from the sessions. I could see if my results confirmed the numerous studies that show there is no difference between males and females with their exhibition of ADHD and determine if one group possibly has more severe ADHD or improves more. I could also see if the longer the patient came to the clinic had any effect on reducing symptoms more. For example, if a patient spaced out their sessions to be just once a week and thus came to the clinic once a week for 6 months v. a patient that had a session every day that allowed them to come to the clinic every day for only a month. I could also see which particular category's score (response time, d prime, or variability) was more influential in reducing the overall ADHD score. Or if more children or adults had their ADHD scores changed from severe (over 200) to average (100-200) or more just reduced within the average range. Since there are so many smaller conclusions and other key trends I can find from the data, I think the hard part would be seeing which are more significant, more related to my research, and more impactful/helpful to the sphere of neuroscience to include in my results section.


So, that has been my week so far. This week I hope I can gain greater insight into my study and find the more nuanced differences that answering my question may yield. This has probably been the most interesting part of my research and the most rewarding in a sense. The fact that the data I chose to analyze and procure actually means something and there is a real-life conclusion coming from my research is truly exciting.

(1510)

2/12/2017

Data Collection Week 2

This week marked the first week of my official data collection. While I did have a later start, starting on Wednesday instead of Monday like I had anticipated, it did not set me back as much as I thought it would. While the goal for number of samples for my study is 24, I had set the week goal to be 12. I was able to look through patient folders and input data for 9 patients. I was coming in 2 hours a day, but next week I plan on coming 4 hours a day, as collecting data per a patient takes around 30 minutes. So far, I have collected consent from 20 patients, 10 adults and 10 children. Next week I hope to get 2 more adults and 2 more children to complete my study. So far, I have 13 females and 7 males, so hopefully the 4 new patients will be males to even the samples more. But if not, it does not pose a problem as gender has not been evidenced to cause variations in how ADHD progresses or manifests.

This week, I was able to organize my data by recording the scores for common, vital categories common to both the test for children (TOVA) and test for adult (IVA).  I recorded the patient number, the type of test conducted, date of birth, age, gender, first testing date, last testing date, number of sessions, targeted areas, targeted frequencies, and other mental disorders to make up the preliminary, demographic information. Then I recorded the scores for the first test of response time (how quickly the subject clicks on the answer), d prime (statistic that describes the patient’s ability to distinguish the target stimulus from other stimuli), and variability (measures reaction time to correct answers). Just to put some context to each score, I recorded how the score compared to the average score for that age through a percentile value and, consequently, if the score would be diagnosed as abnormal (possible error in testing, extremely uncommon), atypical (needs extreme improvement), average (normal for an ADHD patient), or good (above average). Then I calculated the initial “ADHD score” for each patient by adding up the first testing scores and final “ADHD score” from the final testing scores.

At my meeting with Mrs. Haag, I was able to really schedule my time down to the task per day, instead of per week. On Saturday, I worked on outlining my data analysis with my dad’s coworker. I was able to delineate step by step how to show the trend of improvement from initial to final scores. Doing a paired-t test makes the most sense, so I can compare the initial and final testing values within the children and adult age groups and then between the two.  By having figuring out what an average ADHD score is, I was able to see that generally so far my data has reflected that people generally do improve from “severe” to “average” or “good”. I cannot see an apparent difference between adults and children just yet, but I have a lot more data to collect, so I will see in the coming few weeks.

Yesterday, I reorganized my data, sectioning it off into different excel sheets to make it easier to read. While putting the data in, I have a bigger spreadsheet so it is easier to add the scores in while I am at the clinic. But for presenting the data to Mrs. Haag and for my research paper, I have a sheet for adults, children, and then the comparison sheets to show how much final scores have changed from initial to final. I have also been working on finding a way to put the data together to create a conclusion. I will most likely present the t-scores from the paired-t test for the adult group and children group and compare to see which group had a higher trend of improvement.

With my methods slightly tweaked, as now I have contextualization for the scores and average percentiles, I do have to edit my literature review and methods. So, I have been editing that today, other than doing this blog post. For the coming week. I plan to input the rest of the data and continue to edit my data analysis. I will complete 5 more patient data sets each day and have data collecting done by the end of the week.

(711)

2/06/2017

Data Collection Week 1

Now with school over and our research officially beginning, I have started to collect data. Or, at least started to try to. I got really sick over this weekend and had to go to the hospital numerous times because I could not breathe, and today was finally the day I was feeling better and finally got the appropriate medication last night. So, while I was able to collect some data last week (I have two patients done so far), I am behind track on what my original plan was. This scares me as I still have 22 data sheets to analyze and cannot go back to work till Wednesday due to my bronchitis.

There are two solutions to this problem and I am going to start by focusing on the first one: powering through. I will try to power through and get better as soon as possible (it is looking like Wednesday is the day I won't be contagious/ confined to my bed and tissues and gross coughing) and try my best to analyze the results, coming in in the mornings and staying late after. And if I fail to analyze patients in time, I can always try to cut down the number of participants in my study. Mrs. Haag says this is a last resort type option so I will see how option 1 pans out.

In terms of my methods and literature review, I am relieved to have that completely done and awaiting comments. I was able to get some people to read it before I turned it in, so hopefully the technical jargon and dense writing was fixed with their comments.

Without going to school, I can see myself falling victim to forgetting deadlines or not allocating enough time for certain parts of the project without the discipline school schedules have. I see the solution to these problems as keeping a calendar, making sure my work times will still enable me to complete my research work on time, and the meetings with Mrs. Haag definitely refocusing me on my path each week, althought I cannot rely solely on that. I will try to keep to a sleeping, working, and doing research schedule that benefits all three areas.

Now that I have more time, I can focus on how I plan to organize my results into tables in my actual paper.  I have some sort of idea of how this will work, but I am still not sure. I have been looking at sources in my folder and sources I used to replicate and make my own method to see how they organized their results and trying to find the best way to do so. It seems that with a table, I will need to provide some sort of an objective conclusion of the results, just to make the data more digestible and comprehensive for the reader. If it is just a bunch of scores for each category, people are going to be confused at what the means. Furthermore, in the actual conclusion I have to find a way to draw a bigger conclusion, tying together all the smaller conclusions to something that is tangible and makes sense. This is all very vague now because I am still in the beginning of data collection.

I am most stressed and nervous that getting sick is going to compromise my research and I hope this problem can be rectified. Any advice would be greatly helpful. I also must allocate time this week to write up my abstract which is due on Friday. Hopefully, writing this abstract will not only refocus me in my research, but allow me to look at my research from a wider angle and thus help me when I am writing my conclusions.